By AJ Kim
How do planners move beyond bystanding? What does it mean to do rapid response research? We are witness in these times to the ways in which localities, particularly cities, can either contest or comply with unjust laws and policies. How can we as planners resist? What does compliance compromise? As a field with a clear code of ethics, these are always critical questions, but they are especially important in moments of heightened crisis such as the contemporary moment. In this piece, I introduce a counter-mapping project to illustrate one way that planners can respond to the ongoing migrant detention crisis. I start with an overview of the crisis itself, then I describe the project and how it can support action.
Immigration and Customs Enforcement (ICE) encounters, detentions, and deportations are on the rise again under the new presidential administration’s targeting of long-term U.S. residents in major immigrant communities across the United States. The data reflects that current detentions (as of the end of June 2025) have surpassed 56,000. Previously, in 2019, the average number of detainees peaked at about 55,000. During the Biden Administration, detentions continued but fluctuated between 30-40,000 each month. Which is to say, the U.S. criminalization of non-criminal immigrants and refugees is not a new development, but is reaching hitherto unsurpassed levels in the short history of ICE as a federal agency.
Notably, the termination of temporary protected status (TPS) for Haitians and Venezuelans has also created newly “non-legal” immigrants and refugees in the U.S. – people who, through no action or fault of their own, had their legal status immediately terminated by the federal government, leaving them and their families subject to possible arrest, detention and deportation. The detention of families and children had gradually ceased between 2021 and 2024, but has now resumed, with new detention centers for juveniles and adults re-opening, in some cases through private contracts with county officials. The vast majority of all detained immigrants have “non-criminal” status, according to recent data.
Other available data points, present in monthly U.S. Department of Homeland Security (DHS) data but not the focus of existing maps on ballooning detention center sites, are also important to understand, having received little mainstream media attention. For instance, family facilities (where children and adults are held together) quietly resumed operation in April 2025, having previously been shuttered by the prior presidential administration. As of June 28, approximately 640 individuals are being held in these newly reopened family facilities. ICE has also just re-opened their first juvenile facility of 2025, in which approximately 60 children are held in Virginia.The Mexican Consulate in Los Angeles conducted a survey of 330 detainees from my area: this survey revealed that more than 50% of recently abducted immigrants have been in the U.S. for more than ten years, and 30% have U.S.-born children. In fact, according to the latest national data release from DHS, 6,341 of those arrested in 2025 to date are parents of U.S. Citizens. The current regime’s targeting of immigrants will have a reverberating impact on our generation and the next for years to come.
Circumstances (and legislation) change much more rapidly than we as planners can develop adaptations for. Not only does the typical research process move very slowly, but publication can also add delays of anywhere between one and three years, depending on the venue. This type of timeline means urgent, actionable solutions become deferred. There is a model, however, of community-based and community-engaged research that leans into the forms of rapid response and mutual aid, which is practiced by our neighbors daily.
When people are invisibilized, stolen off the street, and disappeared, a powerful challenge is to visualize, create counts, keep tabs, and put these issues on the map. I hope that through conversations with immigrant advocacy groups that I am having now, we as planners can find more ways to continue this and other forms of rapid research responses—a kind of academic mutual aid—to meet needs as they emerge in our communities. I see mutual aid groups, local news sites such as L.A. Taco, social media platforms, and Signal and WeChat networks coming together to share information on rumored and confirmed raids while helping to locate those who have been detained. People over Papers, founded by Kat & Celeste (pseudonyms), crowdsourced a map where people anonymously submit sightings of ICE raids on the ground, and volunteers vet the validity of those reports to the best of their ability. It offers an inspiring example of how we can physically, digitally, and symbolically keep our communities safer. If urban planners can be of help to Kat & Celeste, please reach out!
What can we do right now to protect our communities, our loved ones, our friends, colleagues, and neighbors? What can we contribute with our skills as planners, as scholars, as organizers (identities that need not be separate), in a matter of days, in the moment, as things happen?
While I am primarily a qualitative researcher—my area of expertise is in deep participatory ethnography in close partnership with immigrant workers centers across the country—I saw the need for a broader, nationwide, accessible visualization of the re-opening of detention centers and where they are located. Maps, particularly counter-maps, are uniquely powerful community and participatory tools that offer an alternative narrative: counter-maps can challenge narratives of criminalization by documenting policing (instead of crime, for example).
I recently created the ICE Detention Center tracker as my response to such a moment. Few online visualizations reflect the significant ramp up of detentions since 2020 (although the Vera Institute has recently updated their trends map). I was motivated to act because I live in Los Angeles, where people are disappearing around me as raids occur hourly across my beloved home city.
Between February and April alone, around 50 additional detention centers were opened or re-opened to hold detainees. As of the time of writing, an additional 37 sites have been added to the Tracking Map since its launch, a period of only two weeks. While the data is flawed and reflects approximately a two-week delay (see Deportation Data Project for more information on the public data reporting process by the Department of Homeland Security), I saw utility in a publically-accessible, rapidly updated visualization of available data. As such, I sent it out to local and national networks, with a focus on immigrant advocacy alliances I have worked with for over two decades now.
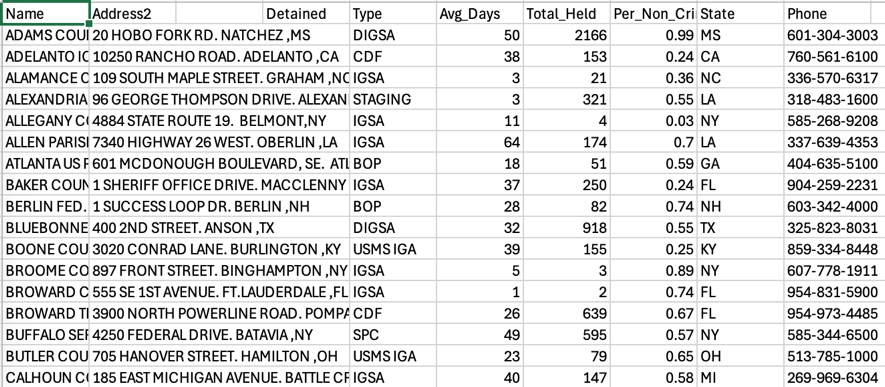
With this map, my intention is not to speak to researchers or connect it to any research project of my own. I receive no funding for this project. Students and scholars at other universities (also not my own) have stepped in to help crowdsource data. The Tracking Map has certain kinds of data I find to be useful for resistance movement building: total persons held, average holding time, percent non-criminal, and perhaps most importantly, contact phone numbers for each facility. Names are named and addresses are given. This map is for those who want not just to know, but to find.
With the passage of the exponentially increased budget for ICE, we can anticipate that these numbers will multiply significantly across the board—for families, for women, for children.
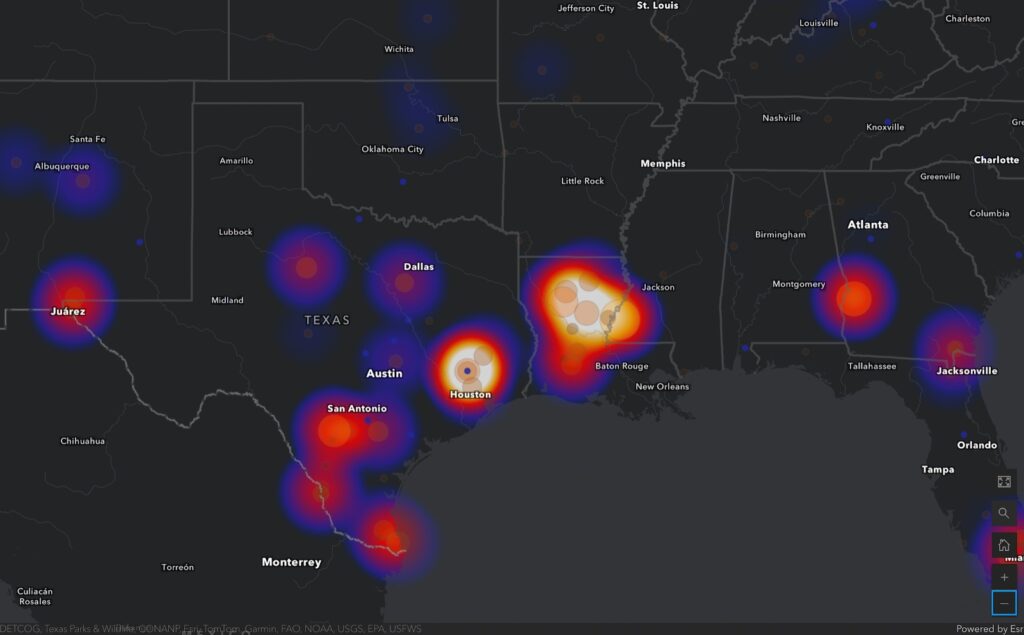
As a planner, I also believe it would be possible, and helpful, to examine pick-up patterns in monthly detention data that documents the frequency and location of ICE and CBP (U.S. Customs and Border Protection) “encounters” with immigrants. Controlling for foreign-born populations by census tract, and examining the nearly one million data points to date, could allow for a spatial understanding of “high-risk” zones for immigrants. We could create a different kind of zoning map – one that would help people stay safe(r), or at minimum, assess their risk and the risk of their loved ones. There is likely to be some level of consistency in where, when, and how detention takes place. Cities (Chicago, Los Angeles, New York) are a major political target under this administration, but the map’s hot spot layer already shows that detention centers are highly concentrated in Texas and Louisiana, above most other states, and that some less dense areas like rural Georgia and Western New York, are also visually over-represented in detention data relative to the population of immigrants nearby.
In the coming months, I’d love to work with volunteers who want to help “track the trackers” and think through other connections (that aren’t in the existing data) that would be helpful at the local scale for community organizers and decision-makers. Cities are adapting their “sanctuary” policies to move beyond symbolic welcome and towards active protection – which in some cases means non-collaboration or non-compliance with federal officers. Several non-profits in Southern California are collecting their own numbers and registries of the disappeared. This helps us know where folks are being picked up (not just where they are sent, as the map currently shows).
Contact me if you have some free hours and want to join this Rapid Research Response network, to do something now.
AJ Kim is Associate Professor of City Planning, School of Public Affairs at San Diego State University.